NASDAQ’s Spring Rally: A 3.5-Month Climb Through Volatility and AI Hype
NASDAQ’s nearly 20% rise from April to mid-July, examining daily volatility, post-Liberation Day recovery, and the role of AI-fueled optimism. It also compares today’s tech rally with the 1999 bubble.

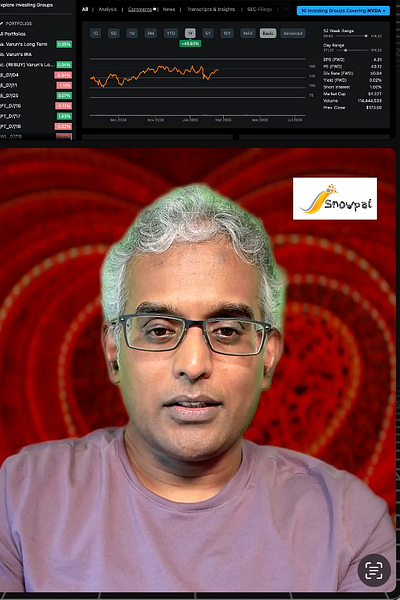
In this podcast, Krish Palaniappan discusses the recent performance of the NASDAQ, analyzing market trends, volatility, and the impact of AI on trading. He provides insights into historical comparisons, daily fluctuations, and potential investment opportunities, while also addressing the current market sentiment and future predictions.
Takeaways
Trading involves significant risk and should be approached cautiously.
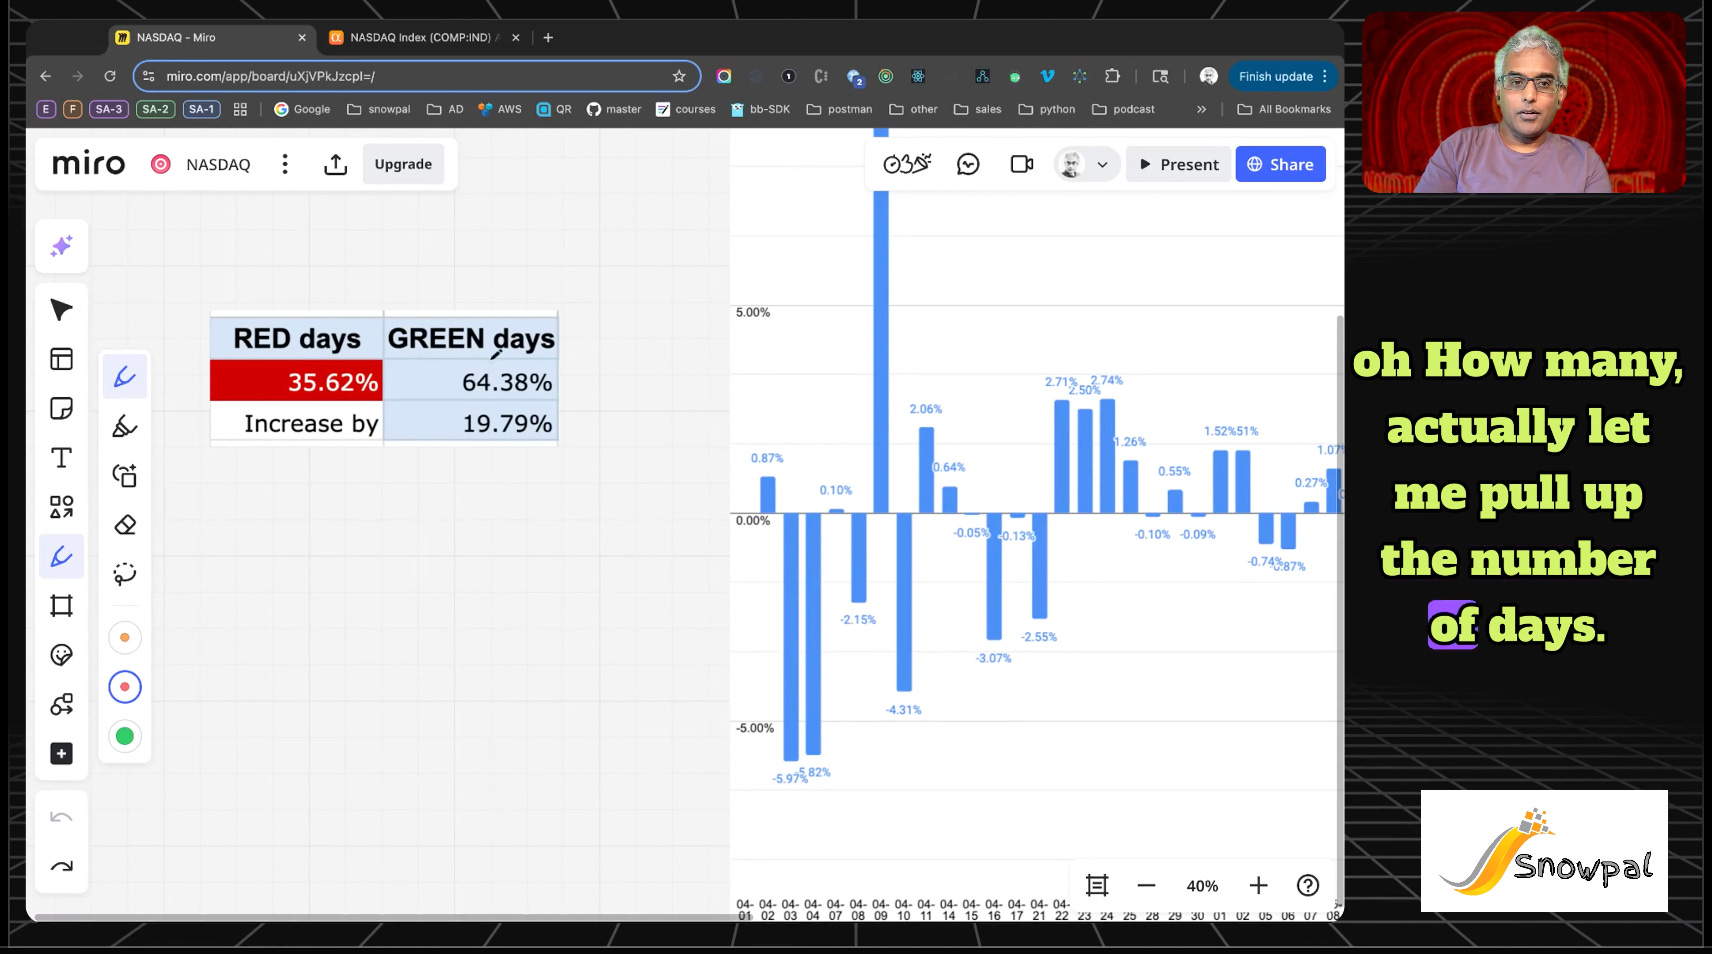
NASDAQ has shown a remarkable increase of nearly 20% in the last three months.
The current AI frenzy is being compared to the 1999 tech bubble, but with more solid earnings.
Two-thirds of the last three months have seen positive market days for NASDAQ.
Increased trading activity has benefited brokerage firms significantly.
Investing right after market dips can lead to substantial gains.
Market volatility has calmed down recently, indicating potential stability.
NVIDIA's stock has surged by 55% in the last three months, showcasing tech growth.
The market is currently on an upward trend, but caution is advised.
A healthy market correction may be on the horizon, which could be beneficial.
Podcast
Summary
Here is a sectional breakdown of the podcast.
1. Introduction & Disclaimer
Opening remarks
Disclaimer: Not financial advice, seek licensed advisors
Scope of episode: NASDAQ’s performance from April 1 to July 17 (~3.5 months)
2. Market Context & Timeframe
Clarifies “Liberation Day” (April 2)
Review period: April 1 to July 17 (~70–73 trading days)
Breakdown: ~35% red days, ~65% green days
Comparison with year-to-date (YTD) performance
3. Performance Analysis
April 1 NASDAQ value: ~17,449
July 17 NASDAQ value: ~20,878
Approximate gain: +20% over 3.5 months
Year-to-date gain: ~8%
Q1 performance: ~-11%
Q2 and Q3 recovery: Significant rebound and growth
4. Historical Perspective & Comparisons
10-year average NASDAQ return: ~15% annually
Compares current AI-driven momentum to 1999 tech bubble
Highlights differences: EPS, revenue backing vs. 1999 hype
RSI nearing 80 (overbought territory)
5. Volatility Snapshot
Post-Liberation Day plunge: ~14% drop in 3 days
Quick rebound of ~12% in following days
Strong correlation between market volatility and earnings season
Brokerage earnings (e.g., Interactive Brokers, Schwab) benefited from trading activity
6. Daily Trends & Patterns
Volatility clusters observed across April to mid-May
Visual patterning: clusters of gains and losses
Shift after May 15 toward more stable upward movement
June 23 to July 17: ~6% increase in ~3 weeks
7. Stock-Specific Highlights
NVIDIA: 55% increase since April ($4.2 trillion market cap)
Meta: Also strong gains
Vertiv: Almost 100% increase
Broader tech strength aligning with NASDAQ trajectory
8. Forward-Looking Views
Prediction: Market might move sideways or experience a healthy correction
Encourages viewers to share their own outlook
Promotes upcoming affordable course on AI’s impact on markets
9. Closing Thoughts
Summary of insights
Call for feedback and engagement
Sign-off