From Spreadsheets to Systems: Building Scalable Developer Tools with AI-Assisted Coding (feat. Jose Duarte)
AI coding tools enable developers & domain experts build data-driven applications faster, shifting focus from coding to problem-solving, system design, and leveraging APIs, databases, and automation.

In this conversation, Krish Palaniappan, a product-focused technologist and podcast host, sits down with Jose Duarte (Founder of DockPops) to explore how AI-assisted development is reshaping software creation. Jose, who leads performance marketing at Pangea Money Transfer, brings a unique perspective as a non-traditional engineer who built internal tools using AI without formal coding expertise. Together, they unpack the technical workflows, architectural decisions, and mindset shifts required to move from manual processes to scalable, API-driven systems in today’s AI-first development landscape.
Modern AI-assisted development has fundamentally shifted how software is conceived, prototyped, and shipped—especially for non-traditional engineers. This article walks through a real-world case of building a data-intensive internal tool using AI-driven workflows, APIs, and modern backend/frontend patterns. The goal is to highlight not just what was built, but how developers can think in this new paradigm.
Podcast
Building Internal Tools with AI-Assisted Coding: A Developer’s Deep Dive — on Apple and Spotify.
Problem Definition: Fragmented Data and Manual Processing
Performance marketing systems—particularly platforms like Meta Ads—often produce highly fragmented datasets. The same creative may exist across multiple campaigns, ad sets, geographies, and languages. While this fragmentation is useful for media buyers, it creates a major challenge for downstream analysis.
The original workflow involved:
Exporting CSV data from Meta Ads
Creating pivot tables in Excel or Google Sheets
Manually aggregating performance across duplicated creatives
Building custom scoring models to evaluate ad performance
This process was:
Time-consuming (monthly or quarterly execution)
Error-prone
Non-scalable for real-time decision-making
The core engineering problem:
Build a system that aggregates, normalizes, and visualizes ad performance data in near real-time.
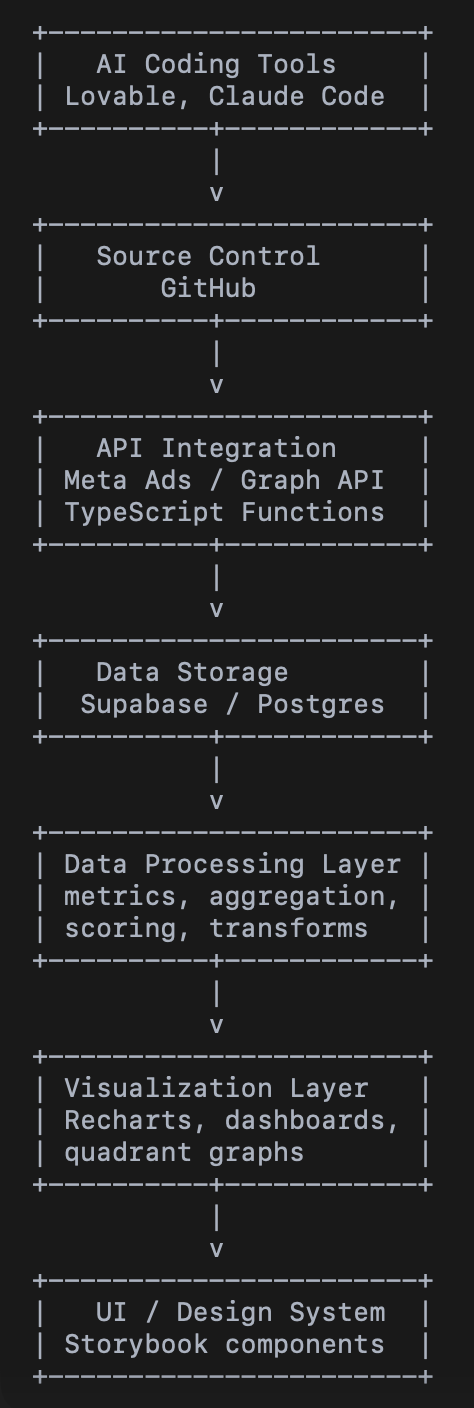
System Architecture Overview
The resulting system follows a lightweight, modern architecture:
          ┌──────────────┐
          │ Meta Ads API │
          └──────┬───────┘
                 │ (Graph API calls)
                 ▼
        ┌────────────────────┐
        │ Data Fetch Layer   │  (TypeScript functions)
        └────────────────────┘
                 │
                 ▼
        ┌────────────────────┐
        │ Processing Layer   │  (Aggregation + normalization)
        └────────────────────┘
                 │
                 ▼
        ┌────────────────────┐
        │ Database (Supabase)│
        └────────────────────┘
                 │
                 ▼
        ┌────────────────────┐
        │ Frontend (Lovable) │
        │ + Chart Libraries  │
        └────────────────────┘
Backend Engineering: Data Ingestion and Constraints
1. API Integration
The system integrates directly with the Meta Ads Graph API:
Authentication via API keys from a custom Facebook App
Selection of specific fields (impressions, clicks, spend, etc.)
Multiple endpoints for different data types (metrics vs creatives)
Key challenge:
Fragmented APIs requiring multiple requests to reconstruct a single dataset
2. Rate Limiting and Data Chunking
The biggest technical bottleneck was managing API constraints:
Too many requests → rate limiting (HTTP 429)
Too large payloads → timeouts and memory issues
Solution:
Implement chunked data fetching
Balance between:
Request frequency
Payload size
Process data incrementally instead of holding large JSON blobs in memory
This reflects a classic distributed systems tradeoff:
Throughput vs latency vs reliability
3. Data Modeling and Storage
Data was stored using Supabase (PostgreSQL-backed):
Schema designed around:
Ads
Daily performance metrics
Creative groupings
Key design decision:
Request only required fields from API (no over-fetching)
Store normalized data ready for aggregation
This avoided:
Excess storage overhead
Additional transformation layers later
Data Processing: From Raw Metrics to Insights
The core transformation involved reconstructing fragmented creatives:
Multiple line items → single logical creative
Aggregations:
Total spend
Total impressions
Total clicks
Then, a custom scoring system was applied:
Performance vs campaign baseline
Relative efficiency metrics
Multi-dimensional scoring
This evolved into two key axes:
Scale potential
Efficiency
Frontend Engineering: Visualization-Driven Development
The system is heavily frontend-driven (~70% UI focus).
1. Rapid Prototyping with AI Tools
Using an AI-native development environment:
UI generated iteratively via prompts
Instant preview loop enabled:
Fast experimentation
Low-cost iteration
No rigid wireframing phase—UI evolved organically.
2. Dynamic Charting and Visual Encoding
A critical breakthrough was visualizing data in a quadrant chart:
X-axis: Efficiency
Y-axis: Scale potential
Each point = an ad creative
Enhancements:
Images as data points (not just dots)
Size scaling based on spend
This enabled:
Instant pattern recognition
Non-technical stakeholder alignment
Example insight:
Creative teams identified color performance differences (e.g., light vs dark blue) in seconds
3. AI-Assisted Library Selection
Instead of manually researching libraries:
The system suggested tools like Recharts
Automatically scaffolded design systems (e.g., Storybook-like environments)
This shifts the developer role from:
“Library selector” → “Intent describer”
Development Methodology: AI-Augmented Thinking
A key framework used during development:
The Rumsfeld Quadrants Applied to Engineering
Known Knowns
Business logic
UX expectations
Problem definition
Known Unknowns
API constraints
Security considerations
Backend limitations
Unknown Knowns
Implicit architectural knowledge
Prior exposure to design patterns (e.g., DRY principles)
Unknown Unknowns
API failures
Edge-case bugs
Tool limitations
Mitigation strategies:
Small iterative steps (Agile-like loops)
AI-based adversarial reviews
Limiting system complexity early
Key Engineering Principles Observed
1. Solve the Hardest Problem First
The developer prioritized:
Data ingestion and sync reliability
before UI work
This prevented:
Building interfaces on unstable foundations
2. Minimize Dependencies
Avoid external connectors
Direct API integration
Reduced cost and complexity
3. Incremental Scope Expansion
Start:
Replicate existing workflow
Then:
Expand capabilities as constraints are removed
4. Developer Role Evolution
Traditional:
Write code
Now:
Define intent
Orchestrate systems
Validate outputs
As stated in the conversation:
The hardest part is no longer writing code—it’s knowing what you want to build.
Outcomes and Impact
The system enabled:
Real-time analysis (vs monthly)
Unified creative performance views
Faster feedback loops with design teams
New types of insights previously infeasible
Most importantly:
A non-coder shipped a production-grade internal tool using AI-assisted workflows
Final Thoughts for Developers
This case illustrates a broader shift:
AI reduces implementation friction
But increases importance of:
Systems thinking
Problem framing
Data modeling
UX intuition
For developers—especially those in product roles—the opportunity is massive:
Build tools closer to the problem
Iterate faster than traditional engineering cycles
Unlock insights previously hidden behind manual workflows
The takeaway is simple but powerful:
The future developer is not just a coder—they are a system designer, data thinker, and problem architect.